
Sellers: Results from the Zillow Consumer Housing Trends Report 2024

The Typical Seller
According to the most recent Census Bureau American Housing Survey (AHS) data, 3% of households in the country have recently sold. Throughout this section, information about sellers comes from CHTR, and information about other groups comes from ZG Population Science analyses using ACS, CPS and AHS data.
Age
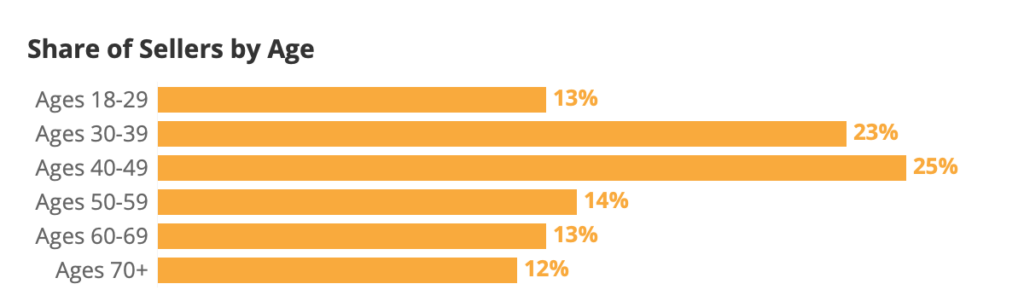
The median age of US sellers is 47. About 13% are under age 30, while roughly a quarter (25%) are in their sixties or older. The age distribution of sellers represents somewhat of a middle ground when it comes to US housing consumers: They are typically younger than tenured homeowners (with a median age of 57) who have not moved in the past year, but older than recent buyers (age 40).
| Age Group | Sellers | Household Decision Makers | US Adults |
| Ages 18-29 | 13% | 12% | 20% |
| Ages 30-39 | 23% | 17% | 18% |
| Ages 40-49 | 25% | 16% | 16% |
| Ages 50-59 | 14% | 17% | 16% |
| Ages 60-69 | 13% | 18% | 15% |
| Ages 70+ | 12% | 19% | 15% |
Source: Household decision maker and US adult estimates from Census Bureau, 2023 Current Population Survey Annual Social and Economic Supplement
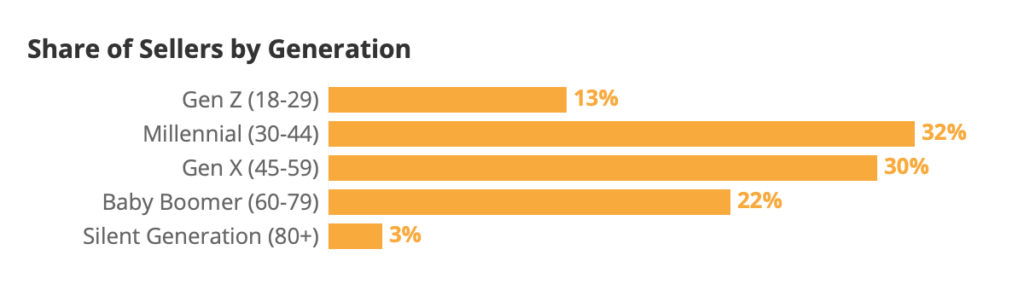
| Generation | Sellers | Household Decision Makers | US Adults |
| Gen Z (18-29) | 13% | 12% | 20% |
| Millennial (30-44) | 32% | 26% | 26% |
| Gen X (45-59) | 30% | 25% | 23% |
| Baby Boomer (60-79) | 22% | 31% | 26% |
| Silent Generation (80+) | 3% | 6% | 5% |
Source: Household decision maker and US adult estimates from US Census Bureau, 2023 Current Population Survey Annual Social and Economic Supplement
Race & Ethnicity
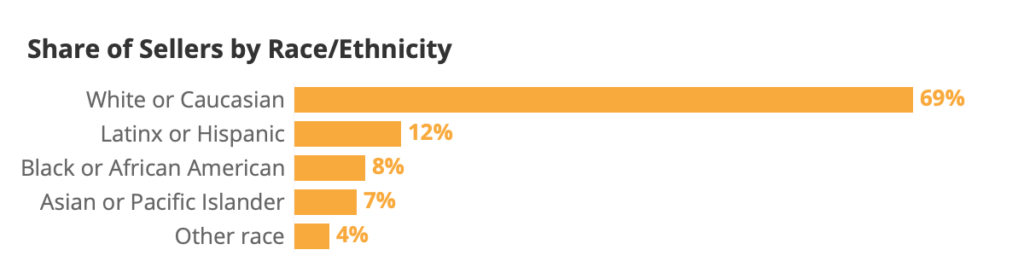
About two thirds of sellers are non-Hispanic white or Caucasian (70%), higher than the overall share of the US adult population that is white (63%).
| Race/Ethnicity | Sellers | Household Decision Makers | US Adults |
| White or Caucasian | 69% | 63% | 60% |
| Black or African American | 8% | 12% | 12% |
| Latinx or Hispanic | 12% | 15% | 17% |
| Asian or Pacific Islander | 7% | 5% | 6% |
| Other race | 4% | 4% | 5% |
Source: Household decision maker and US adult estimates from Census Bureau, 2022 American Community Survey
Region
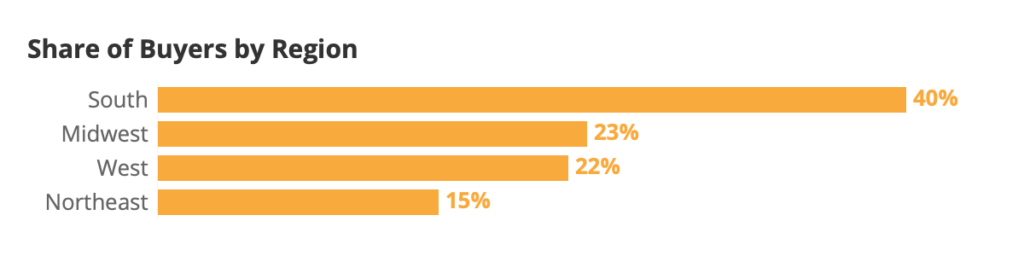
The largest share of sellers live in the South (40%), followed by the Midwest (23%) and West (22%). The smallest share lives in the Northeast (15%). Sellers largely follow the distribution of US adults, with a slightly higher concentration in the South – which has historically had more home construction and inventory than other regions.
| Region | Sellers | Household Decision Makers | US Adults | For Sale Housing Inventory | Inventory (Field Period) | Inventory (Recall Period) |
| South | 40% | 39% | 39% | 55% | 54% | 54% |
| West | 22% | 22% | 24% | 20% | 19% | 19% |
| Midwest | 23% | 21% | 20% | 15% | 15% | 15% |
| Northeast | 15% | 17% | 17% | 10% | 12% | 12% |
Source: Household decision maker and US adult estimates from Census Bureau, 2023 Current Population Survey Annual Social and Economic Supplement
Share of For Sale Housing Inventory comes from Zillow's listings data as of July 11th, 2024.
Income
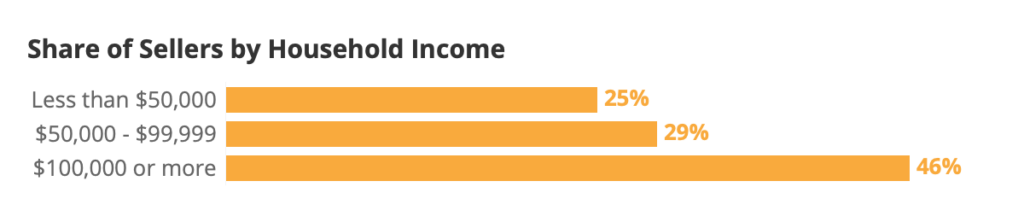
The annual median household income among sellers is $90,000 to $94,999, higher than the overall national median of $74,580.
| Income | Seller Households | All US Households |
| Less than $50,000 | 25% | 34% |
| $50,000 – $99,999 | 29% | 29% |
| $100,000 or more | 46% | 37% |
Source: All US household estimates from Census Bureau, 2023 Current Population Survey Annual Social and Economic Supplement
Education
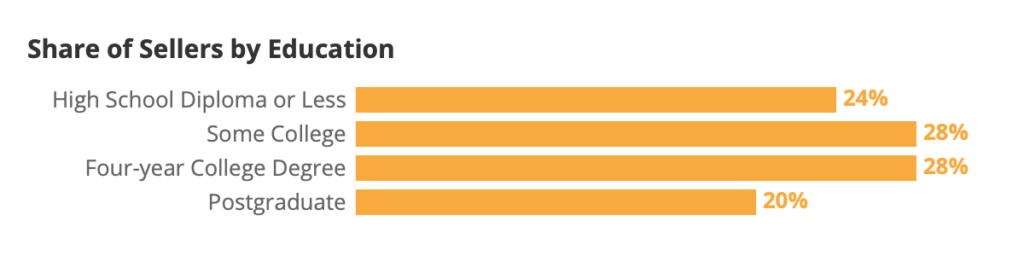
Sellers tend to be more educated than US household decision makers overall: 49% of sellers have at least a four-year degree, higher than 35% of overall U.S. household adults.
| Education | Sellers | Household Decision Makers | US Adults |
| High School Diploma or Less | 24% | 35% | 39% |
| Some College | 28% | 27% | 26% |
| Four-year College Degree | 28% | 24% | 22% |
| Postgraduate | 20% | 14% | 13% |
Source: All household estimates from Census Bureau, 2023 Current Population Survey Annual Social and Economic Supplement
Relationship Status
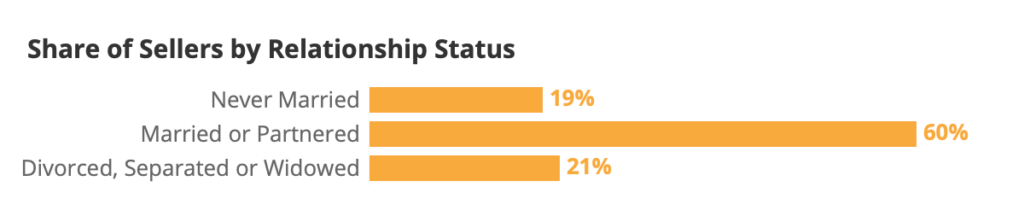
About 82% of sellers said that at least one life event influenced their decision to move and sell their home, like a change in household or family size (56%), or marriage, divorce or separation (37%). Prior research has shown that the sale and purchase of a home is often tied to family formation or other life events. This relationship between homeownership and family formation helps to partially explain why most sellers are either currently married/partnered (70%) or have been married in the past (15%).
| Relationship Status | Percent of Sellers | Percent of Household Decision Makers | Percent of US Adults |
| Never Married | 19% | 18% | 25% |
| Married or Partnered | 60% | 59% | 60% |
| Divorced, Separated or Widowed | 21% | 23% | 16% |
Source: All household estimates from Census Bureau, 2023 Current Population Survey Annual Social and Economic Supplement
The Typical Home
Beds, baths, beyond
The typical (median) seller sold a 3-bed, 2.5-bath, single-family detached house between 2,000 and 2,499 square feet.
Sale price
As high rates drive up monthly payments for most buyers, sellers show no sign of accepting lower prices. The median seller reported selling their home for $300,000 in 2024, up from $285,000 in 2022, despite higher rates driving up monthly mortgage payments and forcing many would-be buyers to the sidelines.
| 2018 | 2019 | 2020 | 2021 | 2022 | 2023 | 2024 | |
| May ZHVI (rounded) | $227,000 | $239,000 | $252,000 | $288,000 | $338,000 | $342,000 | $363,000 |
| Median Self-Reported Final Sale Price | $210,000 | $222,000 | $225,000 | $230,000 | $285,000 | $300,000 | $300,000 |
The median self-reported sale price has consistently trended lower than the Zillow Home Value Index (ZHVI) – $363,000 in June 2024. While ZHVI represents what a buyer could expect on the “open market”, the small share of sellers that sell to people they already know personally–including, like buying from family, friends, or someone a buyer knows personally– likely attributes to this lower estimate.
Average occupancy lasts 12 years before selling
The average seller reported living in their home for 12 years. In recent years, sellers have reported shorter durations in their home before selling.
Average years in home before selling
| 2018 | 2019 | 2020 | 2021 | 2024 |
| 16 | 16 | 17 | 14 | 12 |
Build year
Resale homes tend to be slightly newer than the US housing stock as a whole. For example, sold homes are about half as likely to be built in 1939 or earlier (5% versus 11% of occupied US homes overall) or in the 1940s and 50s (7% vs 14%). Conversely, sold homes are not quite twice as likely to be built in or after 2000 (46% vs 26%).
| Home build year | Sold homes | All occupied US homes |
| 1939 or earlier | 5% | 11% |
| 1940 to 1959 | 7% | 14% |
| 1960 to 1979 | 17% | 24% |
| 1980 to 1999 | 26% | 25% |
| 2000 to 2019 | 37% | 24% |
| 2020 or later | 9% | 2% |
Source: All occupied US homes from Census Bureau, 2022 American Community Survey
Share that Buy Falls, Still the Majority of Sellers
Record low share of sellers also buy a home
Just over half of sellers (54%) reported buying a home in addition to selling one – the smallest share since at least 2018.
Share of sellers that also purchased a home
| 2018 | 2019 | 2020 | 2021 | 2022 | 2023 | 2024 |
| 61% | 64% | 63% | 65% | 71% | 70% | 54% |
Move to a home they already owned is most common for sellers that did not also buy
Among the 46% of sellers that did not also buy, not quite half (42%) reported that they moved to a home that they already owned, but did not purchase in the past year. Other living situations included a long-term rental (17%), an inherited home (15%), and moving into the home that their spouse or partner already owned (10%).
Current living situation of sellers that did not also buy a home
| Among sellers that did not recently buy | |
| Home they already owned (but did not purchase in the past year) | 42% |
| Inherited home | 15% |
| Spouse/partner's owned home | 10% |
| Long-term rental | 17% |
| Short-term rental | 3% |
| Staying with family | 5% |
| Staying with friends | 2% |
| Hotel | 1% |
| Other | 3% |
Most seller-buyers upgrade to a more expensive, newer home
About half of seller-buyers upgraded — buying a more expensive home than the one they sold (56%). About a third spent less (32%) and one in eight (12%) spent about the same.
Different definitions of “upgrade”, “sidegrade”, and “downgrade” reveal different trends: Seller-buyers are more likely to buy a more expensive home (56%) than one with more bedrooms (35%). Buying a newer home (52%), a home with more bathrooms (47%), and/or a larger home (46% – greater square footage) are also relatively common.
Share of seller-buyers that upgraded, sidegraded, or downgraded by different definitions
| Sale price | Square ft | Bedrooms | Bathrooms | Build year | |
| Upgrade
(Purchased home > sold home) |
56% | 46% | 35% | 47% | 52% |
| Sidegrade
(Purchased home = sold home) |
12% | 36% | 44% | 31% | 39% |
| Downgrade |
32% | 18% | 21% | 22% | 10% |
Upsizing seller-buyers trend younger
The typical seller who upgraded to a more expensive home (median age 46), a larger home (age 45), a home with more bedrooms (age 45) and/or bathrooms (age 46) tended to be younger than those who downgraded (ages 51, 51, 52, and 51, respectively).
Upsizing/Upgrading
| Seller-buyers that bought | Total | Age 18-29 | Age 30-39 | Age 40-49 | Age 50+ |
| A more expensive home | 56% | 58% | 60% | 68% | 45% |
| More square feet | 46% | 44% | 55% | 47% | 40% |
| More bedrooms | 35% | 37% | 44% | 40% | 24% |
| More bathrooms | 47% | 39% | 54% | 63% | 34% |
| A newer home | 52% | 39% | 48% | 50% | 59% |
Downsizing/Downgrading
| Seller-buyers that bought | Total | Age 18-29 | Age 30-39 | Age 40-49 | Age 50+ |
| A less expensive home | 32% | 32% | 23% | 22% | 45% |
| Fewer square feet | 18% | 14% | 11% | 15% | 26% |
| Fewer bedrooms | 21% | 15% | 12% | 16% | 32% |
| Fewer bathrooms | 22% | 25% | 13% | 17% | 31% |
| An older home | 10% | 12% | 10% | 10% | 8% |
Most seller-buyers sell first, then buy
A majority of dual seller-buyers (54%) said they sold first and then bought. About one in three (31%) said they bought first, and the remainder (14%) said they did both at or around the same time.
Managing to sell and buy at the same time is the exception for all age groups, but older seller-buyers were most likely to pull it off: About one in six in their 50s (18%) or 60s and older (17%) managed both at the same time, versus only 10% in their 30s and 8% in their 20s and younger.
Long-distance moves are uncommon
Most sellers stay local: 58% reported moving to the same zip code where they sold. Smaller shares changed zips, but stayed in the same city (8%), county (8%) or state (11%). Only about one in six (15%) moved to a different state.
Among sellers that moved to another state, California (10%) and Florida (10%) were the most common destinations. Sellers that moved to either state differed significantly by age: The typical seller that moved to California (median age 46) was about 20 years younger than one that moved to Florida (age 66).
Motivations to Sell & Move
Life events largely motivated homeowners to sell
Most sellers (78%) cite at least one life event as an influence on their decision to move and sell their home. The most common was a change in household or family size (51%), followed by a new job or job transfer (37%).
| Influenced decision to move and sell | Total Sellers | Also bought a home | Did not also buy |
| Change in household or family size | 51% | 49% | 54% |
| New job or job transfer | 37% | 32% | 45% |
| Working remotely more often | 35% | 30% | 41% |
| Retired | 32% | 28% | 37% |
| Got married, divorced or separated | 32% | 27% | 39% |
| Working remotely less often | 29% | 24% | 37% |
| Job loss or other involuntary unemployment | 29% | 21% | 39% |
| NET: Life event influenced | 78% | 73% | 84% |
Location, size, layout among other desired changes
Regarding characteristics of the home itself, sellers were most likely to cite wanting a new location (48%) as a contributor to their decision to move and sell – followed distantly by the home being too small (22%) and wanting a different layout or floor plan (22%). Too much maintenance (16%) and the home being too big (16%) were the least common.
| Contributed to decision to move and sell | Total Sellers | Also bought a home | Did not also buy |
| Location – I wanted to live somewhere else | 48% | 53% | 42% |
| Home was too small | 22% | 23% | 21% |
| I wanted a different layout/floor plan | 22% | 22% | 20% |
| I wanted different/updated features and finishes | 19% | 19% | 20% |
| Home was too big | 16% | 18% | 15% |
| Home needed too much maintenance | 16% | 14% | 18% |
| Something else | 5% | 4% | 5% |
The Typical Seller Timeline
Sellers most commonly report some urgency, little rush
Sellers were most likely to describe their selling timeline as “medium” (47%) – some urgency, but not rushed. About two in five sellers said their timeline was “relaxed” (39%) – able to take their time and wait for the best offer. And the smallest share (16%) said they faced a “short” timeline in which they have to sell their home quickly.
| Described their Timeline as… | 2022 | 2023 | 2024 |
| Short: I had to sell my home quickly | 18% | 16% | 18% |
| Medium: There was some urgency, but I was not rushed | 42% | 45% | 47% |
| Relaxed: I was able to take my time and wait for the best offer | 40% | 39% | 35% |
3-4 months of serious consideration typically precede officially listing
The typical (median) seller reported seriously thinking about selling for 3 to less than 4 months before ultimately listing their home. About one in ten (9%) said they thought about it for less than a month, while closer to one in four (23%) said they thought it over for 6 months or longer.
Older sellers were more likely to report a longer time thinking about selling: Almost a third of sellers in their sixties and older (34%) reported taking six months or more, while smaller shares of sellers in their 30s (13%) and younger (15%) said the same.
| Seriously thought about selling home before listing for | Total Sellers | Age 18-29 | Age 30-39 | Age 40-49 | Age 50-59 | Age 60+ |
| Less than 1 month | 9% | 7% | 9% | 8% | 9% | 10% |
| 1 to less than 2 months | 13% | 16% | 16% | 10% | 12% | 11% |
| 2 to less than 3 months | 23% | 29% | 29% | 27% | 14% | 16% |
| 3 to less than 4 months | 19% | 20% | 19% | 22% | 18% | 15% |
| 4 to less than 6 months | 13% | 13% | 14% | 9% | 17% | 14% |
| 6 months or more | 23% | 15% | 13% | 23% | 29% | 34% |
Almost two thirds considered renting out their home before selling
About two thirds of sellers (66%) said they at least thought about renting out their home. A smaller share (28%), however, said they seriously considered renting out their home.
Sellers at least considering renting out their home before ultimately selling has been increasingly common since 2021, when just under half (47%) reported considering it.
| 2020 | 2021 | 2022 | 2023 | 2024 | |
| Never considered renting out home | 51% | 53% | 47% | 36% | 34% |
| Seriously considered renting out instead of selling | 31% | 24% | 23% | 30% | 28% |
| Thought about renting out, but more serious about selling | 18% | 23% | 30% | 34% | 38% |
| Net: Considered renting out home | 49% | 47% | 53% | 64% | 66% |
Younger sellers were especially likely to say that they considered renting out their home before ultimately selling.
| Total Sellers | Age 18-29 | Age 30-39 | Age 40-49 | Age 50-59 | Age 60+ | |
| Never considered renting out home | 34% | 18% | 17% | 28% | 34% | 64% |
| Seriously considered renting out instead of selling | 28% | 31% | 37% | 32% | 29% | 12% |
| Thought about renting out, but more serious about selling | 38% | 51% | 46% | 40% | 36% | 23% |
| Net: Considered renting out home | 66% | 82% | 83% | 72% | 66% | 36% |
It's a Seller's Market, but Far from Effortless for Sellers
Offers received
While the median seller has reported getting the same number of offers (2 offers), the share that reported receiving 4 or more offers is either stagnant or on the decline. About one in seven (17%) got at least 4 offers on their home.
The share of sellers that report selling without any offers has stayed historically low at 3%.,
| Number of Offers | 2018 | 2019 | 2020 | 2021 | 2022 | 2023 | 2024 |
| 0 | 11% | 14% | 12% | 9% | 3% | 2% | 3% |
| 1 | 36% | 36% | 37% | 31% | 23% | 20% | 22% |
| 2 | 23% | 22% | 23% | 20% | 27% | 33% | 34% |
| 3 | 14% | 12% | 13% | 16% | 22% | 26% | 24% |
| 4 or more | 15% | 17% | 14% | 24% | 26% | 19% | 17% |
| Median | 2 | 2 | 2 | 2 | 2 | 2 | 2 |
Half say an offer fell through
Sellers surveyed in 2024 reported a 50-50 split when it came to having at least 1 offer fall through.
| Number of Offers that Fell Through | 2018 | 2019 | 2020 | 2021 | 2022 | 2023 | 2024 |
| 0 | 59% | 60% | 58% | 56% | 54% | 44% | 50% |
| 1 | 24% | 21% | 21% | 21% | 23% | 25% | 26% |
| 2 | 8% | 9% | 10% | 11% | 12% | 18% | 13% |
| 3 | 4% | 3% | 4% | 6% | 7% | 8% | 8% |
| 4 or more | 5% | 8% | 7% | 7% | 4% | 4% | 4% |
| Median | 0 | 0 | 0 | 0 | 0 | 1 | 0 |
Money, financing most common reason an offer falls through
For sellers that said at least one offer fell through, the most common reason was issues with money, mortgage, or financing (40%). The buyer being unable to sell their home (26%), an appraisal lower than the purchase price (23%), and issues from the inspection report (23%) followed.
| Reason sellers say an offer fell through | |
| Issues with money/mortgage/financing | 40% |
| The buyer could not sell their home | 26% |
| Appraisal was lower than purchase price | 23% |
| Issues from the inspection report | 23% |
| Another reason | 13% |
| I do not know | 5% |
Most sellers get a cash offer
Most sellers (63%) said that at least one of the offers they received was all cash or did not include a financing contingency.
| Number of all cash offers received | 2021 | 2022 | 2023 | 2024 |
| 0 | 44% | 38% | 33% | 35% |
| 1 | 33% | 38% | 42% | 43% |
| 2 | 12% | 14% | 14% | 15% |
| 3 | 5% | 6% | 8% | 4% |
| 4 or more | 6% | 5% | 3% | 1% |
| NET: At least 1 | 56% | 63% | 67% | 63% |
| Median | 1 | 1 | 1 | 1 |
More to an offer than cash
Despite the appeal of cash offers, about half of sellers who get one ultimately choose a different offer that includes a financing contingency (52%) – suggesting that buyers who finance with a mortgage can still compete with cash offers.
Ultimately chose an offer contingent on the buyer successfully receiving financing
| Total Sellers | Sellers that received at least 1 cash offer |
| 54% | 52% |
Not surprisingly, sellers generally value money and time when selling their home. When asked about their top consideration when selling, most have consistently reported maximizing profit as their top priority (56% of sellers reported this as their top priority and 85% ranked it among their top two). Second to profit, sellers have been most likely to consider selling within their target timeframe a top priority (35%, 88% among their top two). Taken together, these rankings suggest that a cash offer can still fail if a seller feels that the offer is too low or risks delaying the sale (insufficient earnest money or the offer being contingent on the sale of the buyer's home, for example).
Home inspections are still common, despite offers waiving inspection contingencies
About half of sellers (52%) said they received at least one offer that waived an inspection. However, most sellers overall (58%) and about half of sellers who receive an inspection-waiving offer (52%) ultimately choose an offer that includes an inspection contingency.
| Inspection-waiving offers received | 2021 | 2022 | 2023 | 2024 |
| 0 | 53% | 43% | 37% | 46% |
| 1 | 27% | 34% | 36% | 35% |
| 2 | 11% | 13% | 17% | 12% |
| 3 | 4% | 5% | 5% | 5% |
| 4 or more | 5% | 4% | 4% | 1% |
| NET: At least 1 | 47% | 56% | 63% | 52% |
| Median | 0 | 1 | 1 | 1 |
Ultimately chose an offer contingent on the property passing a home inspection
| Total Sellers | Sellers that received at least 1 inspection-waiving offer |
| 58% | 52% |
The discrepancy between offers that waive inspections and the share of buyers who complete one suggests that waiving inspection contingencies is not a surefire way to win against other offers. Much like competing with cash, buyers who insist on an inspection can still generally win if their offer is adequately appealing to a seller's desire for profit and preferred timeline.
| 2018 | 2019 | 2020 | 2021 | 2022 | 2023 | 2024 | |
| 0 Inspections completed by a potential buyer | 19% | 21% | 19% | 16% | 14% | 10% | 11% |
| 1-3 Inspections | 73% | 71% | 72% | 73% | 79% | 83% | 82% |
| 4 or More Inspections | 8% | 8% | 9% | 12% | 7% | 6% | 7% |
| Median number of inspections | 1 | 1 | 1 | 1 | 1 | 1 | 1 |
Financing, inspection, appraisal among most common contingencies
Most sellers say that the offer they ultimately accepted was contingent on the property passing a home inspection (58%). The buyer successfully receiving financing (54%) and a minimum appraisal (51%) were also relatively common.
| Seller ultimately accepted offer contingent on | 2022 | 2023 | 2024 |
| Financing | 54% | 60% | 54% |
| Appraisal | 53% | 57% | 51% |
| Inspection | 61% | 66% | 58% |
| Sale of buyer's previous home | 34% | 47% | 34% |
| Rate buydown |
|
43% | 36% |
Most of the time, sellers pay some closing costs
In the final offer they accepted, most buyers said that they agreed to pay some (43%) or all (24%) closing costs.
Digital Tools & Seller Demand for Them
Desire for digital options outpaces current offering
While 88% of sellers reported using at least one digital tool when selling their home, an even greater share (92%) said they would ideally use at least one – a six point divide.
The most common digital tool that sellers reported using was signing paperwork online/digitally (56% did this, but 59% said they would like to). Storing home sale documents digitally in one central service (39%) and using remote or mobile notary options to complete closing (35%) were less common.
| Share of sellers that used/would ideally use each digital tool | Used | Would Ideally Use |
| Sign paperwork online/digitally | 56% | 59% |
| Use remote or mobile notary options to complete closing | 35% | 45% |
| Store home sale documents digitally in one central service | 39% | 46% |
| At least one of the above | 88% | 92% |
Sellers Value Floor Plans, Virtual Tours in their Listings
Virtual tours, interactive floor plans, high resolution photography make sellers more likely to hire an agent
Most sellers say they are more likely to hire an agent who includes virtual tours and/or interactive floor plans in their services (71%). Most also said that they are more likely to hire an agent that includes high resolution photography (78%) in their services.
| Sellers that say they are more likely to hire an agent that includes each in their services | 2022 | 2023 | 2024 |
| Virtual tours and/or interactive floor plans | 70% | 78% | 71% |
| High resolution photography | – | 81% | 78% |
Most sellers consider floor plans and virtual tours highly important
Most sellers say that including a virtual tour in their home listing is very or extremely important (64%) – compared to only 9% who said it was not very or not at all important. An even larger share (81%) said that including a floor plan in their home listing was a highly important listing characteristic (versus 4% who said it was not very/not at all important).
| Sellers consider as very/extremely important part of their home listing | 2022 | 2023 | 2024 |
| Virtual tour | 60% | 69% | 64% |
| Floor plan | 76% | 82% | 81% |
Selling Activities
At least 2 open houses for most
Sellers surveyed in 2024 report a continuation of 2023's trend, where the median seller reported having 2 open houses — up from 1 in prior years.
| Share of Sellers that Reported Having | 2018 | 2019 | 2020 | 2021 | 2022 | 2023 | 2024 |
| 0 Open Houses | 37% | 38% | 39% | 43% | 33% | 21% | 23% |
| 1-3 Open Houses | 49% | 44% | 45% | 44% | 56% | 68% | 65% |
| 4 or More Open Houses | 14% | 16% | 16% | 13% | 11% | 11% | 12% |
| Median number of open houses | 1 | 1 | 1 | 1 | 1 | 2 | 2 |
Leaving the home for a showing becomes more common again
Most sellers report leaving their home at least once for a private showing or open house (71%). The share that reported leaving 0 times (29%) shows a return to historic levels after 2023's dip to 22%.
| Share of Sellers that Reported Leaving Their Home for a Private Showing or Open House | 2019 | 2020 | 2021 | 2022 | 2023 | 2024 |
| 0 times | 30% | 28% | 32% | 28% | 22% | 29% |
| 1-3 times | 39% | 40% | 42% | 51% | 63% | 57% |
| 4 times or more | 31% | 32% | 27% | 19% | 15% | 15% |
| Median | 2 | 2 | 1 | 1 | 2 | 2 |
Taking home off the market is the exception
About three in ten sellers (68%) say that they never took their home off the market before it ultimately sold. Temporarily taking a home off the market appeared to become more common in after 2021 (28%), growing slightly in 2022 (31%) and again in 2023 (40%). That trend has since come to a halt, dropping to 32% in 2024.
| Share of Sellers that Reported temporarily taking their home off the market | 2018 | 2019 | 2020 | 2021 | 2022 | 2023 | 2024 |
| 0 times | 71% | 71% | 66% | 72% | 69% | 60% | 68% |
| 1-3 times | 25% | 23% | 26% | 23% | 27% | 35% | 28% |
| 4 times or more | 4% | 6% | 8% | 5% | 5% | 5% | 4% |
| Median | 0 | 0 | 0 | 0 | 0 | 0 | 0 |
Most make at least 1 home improvement
Most sellers (72%) said they completed at least one improvement project as part of selling their home (e.g. painting, redecorating, kitchen improvement, new appliances, replacing/repairing flooring, etc).
| 2021 | 2022 | 2023 | 2024 | |
| Completed at least one home improvement | 71% | 71% | 79% | 72% |
Interior paint, bathroom & kitchen improvements most common
Among sellers that reported making any improvements, the most common was painting the interior of the home (46%), followed by bathroom (42%) and kitchen (38%) improvements.
| All Sellers | Sellers that made any improvement | |
| Painted interior of home | 32% | 46% |
| Bathroom improvement | 29% | 42% |
| Kitchen improvement | 27% | 38% |
| Landscaped yard | 25% | 35% |
| Replaced or repaired new carpet or flooring | 20% | 28% |
| Painted exterior of home | 19% | 28% |
| Replaced or purchased new appliances | 18% | 26% |
| Replaced or repaired roof | 15% | 22% |
| Redecorated entire home or specific rooms | 14% | 20% |
| Replaced or purchased new furnishings | 13% | 19% |
| Other | 3% | 4% |
Younger sellers more likely to report home improvements
Younger sellers are more likely to report completing at least one home improvement: 80% of sellers in their 20s or younger say they completed at least one, as did 85% of sellers in their 30s, 77% in their 40s, 64% in their 50s, 62% in their 60s, and 54% of those in their 70s and older.
| Share of sellers that completed at least one home improvement | All Sellers | Ages 18-29 | Ages 30-39 | Ages 40-49 | Ages 50-59 | Ages 60-69 | Ages 70+ |
| 72% | 80% | 85% | 77% | 64% | 62% | 54% |
The Seller-Agent Relationship
Almost all sellers (93%) indicate some kind of agent use. The largest share (69%) said they hired an agent to help promote their home and find potential buyers. And about one in five (21%) said they hired an agent to finalize the sale, but found potential buyers and promoted the home on their own.
Sellers stick with agents
Rising digital options like remote viewings, 3D tours, and instant offers appear to complement the services that real estate agents offer – not replace them. Most sellers' use a real estate agent, and sellers are more likely to use a real estate agent (89%) than other resources to sell their home, such as a website on a computer (75%), mobile website (69%) or app (64%).
| Share of sellers who used each resource to help sell or promote the sale of their home | 2019 | 2020 | 2021 | 2022 | 2023 | 2024 |
| Real estate agent | 83% | 83% | 82% | 88% | 90% | 89% |
| Website on a laptop / desktop computer | 51% | 54% | 66% | 64% | 75% | 74% |
| Mobile website on a smartphone / tablet | 40% | 44% | 55% | 55% | 69% | 69% |
| App on a smartphone / tablet | 37% | 42% | 48% | 51% | 64% | 63% |
Most sellers hire the first agent they contact
The typical (median) seller contacted only 1 agent. Among sellers that used an agent, 59% contacted only 1. About two in five (39%) contacted between 2 and 4. Only 2% reported contacting 5 or more.
| Before ultimately hiring their agent, sellers reported contacting | Sellers that used an agent | First-time seller | Repeat seller |
| 1 agent | 59% | 64% | 53% |
| 2 agents | 23% | 22% | 25% |
| 3 agents | 13% | 11% | 16% |
| 4 agents | 3% | 1% | 5% |
| 5 agents or more | 2% | 2% | 1% |
| Median number of agents contacted | 1 | 1 | 1 |
Dual seller-buyers usually hire the same agent for both transactions
Among seller-buyers that used an agent, about three quarters (73%) reported hiring the same agent to help sell their previous home and buy their new one.
About 1 in 3 sellers first found their agent online
Among sellers that used an agent, the share reporting that they first found their agent on a real estate website or app fell slightly (to 22% in 2024, versus 27% in 2023). The share that first found their agent online remained similar (36% in 2024 and 38% in 2023). Consistent with last year's findings, past experience with their agent continues to fall from its high of 23% in 2018 to 8% in 2024.
| Where sellers with an agent that said they first found their agent | 2018 | 2019 | 2022 | 2023 | 2024 |
| Real estate website / app (e.g. Zillow, RE/MAX, Realtor.com) | 9% | 2% | 20% | 27% | 22% |
| Search engine (e.g. Google, Bing) | 3% | 8% | 4% | 6% | 7% |
| Social networking website / app (e.g. Facebook, Nextdoor, Twitter, Instagram) | 3% | 6% | 6% | 6% | 7% |
| Net: Online | 15% | 16% | 30% | 38% | 36% |
| Past experience with this agent, realtor, or broker | 23% | 21% | 15% | 11% | 8% |
| Attended an open house and met agent or broker | 5% | 7% | 5% | 5% | 5% |
| Saw contact information on For Sale/Open House sign | 5% | 5% | 3% | 5% | 4% |
| Referral from other agent, realtor, or broker | 3% | 6% | 5% | 4% | 4% |
| Referral from friend, relative, neighbor or colleague | 28% | 22% | 18% | 18% | 19% |
| Referral from home builder | – | – | 3% | 3% | 4% |
| Net: Referral | 31% | 28% | 26% | 25% | 28% |
| Newspaper ad | 1% | 3% | 2% | 1% | 2% |
| Direct mail (e.g. newsletter, flier, postcard) | 2% | 3% | 3% | 3% | 3% |
| Know them from my community | 13% | 16% | 12% | 9% | 11% |
| Other | 5% | 1% | 2% | 3% | 2% |
Trustworthy, responsive among highly important agent characteristics
Like in previous years, trustworthy (80%) and responsive (80%) first impressions were among the characteristics sellers were most likely to consider highly important in an agent. Also high were a positive reputation in the community (75%), local and neighborhood-specific knowledge (75%), and strong sales history (74%).
| Considered each characteristic very/extremely important in an agent, among sellers that used an agent | 2018 | 2019 | 2022 | 2023 | 2024 |
| Positive general reputation in the community | 74% | 68% | 72% | 77% | 75% |
| Was part of a recognizable brokerage (e.g. RE/MAX, Coldwell Banker, Century21) | 57% | 55% | 53% | 63% | 58% |
| Strong sales history / high number of recent sales | 69% | 66% | 67% | 77% | 74% |
| Online reviews and ratings of the agent or broker | 49% | 52% | 56% | 73% | 67% |
| Agent or broker was part of a team | 46% | 50% | 51% | 62% | 59% |
| Past personal experience with the agent or broker | 55% | 58% | 58% | 65% | 58% |
| Referral from friend, relative, neighbor or colleague | 52% | 52% | 56% | 64% | 57% |
| Initial impression of agent or broker: responsive | 81% | 76% | 74% | 82% | 80% |
| Initial impression of agent or broker: trustworthy | 86% | 77% | 78% | 84% | 80% |
| Had local market and/or neighborhood-specific knowledge | 80% | 74% | 74% | 77% | 75% |
| Charged a lower commission or offered a rebate | 49% | 49% | 57% | 62% | 55% |
Half of sellers say they negotiated to lower their agent's commission
About half of sellers who used an agent say that they negotiated with them for a lower commission (51%).
Non-negotiators mostly say their agent's commission was fair
Agent-using sellers who did not try to negotiate their agent's commission were most likely to say that they did not because they thought the commission was fair (64%). Less common reasons were not knowing they could negotiate (26%) and not feeling comfortable negotiating with their agent about their commission (14%).
Sellers that negotiate are more likely to shop around for an agent
Most (55%) sellers that negotiated with their agent for a lower commission said that they contacted more than one agent – versus only about a quarter (26%) of sellers that never negotiated.
Negotiators trend younger and higher-income
The typical seller who negotiated with their agent for a lower commission (median age 40) is about eight years younger than those who did not negotiate (48). These negotiators also tend to have higher incomes and home sale prices.
| Among sellers that used an agent | Negotiated commission | Did not negotiate |
| Median age | 40 | 48 |
| Median household income | $100,000 to $124,999 | $85,000 to $89,999 |
| Median sale price (sold home) | $300,000 | $275,000 |
| Also bought a home | 49% | 61% |
| Used same agent to sell and buy | 81% | 67% |
| Median purchase price (purchased home) | $360,000 | $315,000 |
Sellers who negotiated tended less likely to also buy a home, but when they did buy, they were more likely to hire the same agent to broker both their home sale and their home purchase, and those home purchase prices tended to be higher.
Three in four sellers say their agent's commission was fair
About three in four sellers who worked with an agent said that their agent's commission was fair for the service they provided (73%). About one in five (20%) said the commission was too high, and a small 7% said that it was too low.
Survey Methodology
Research Approach
In order to gain a comprehensive understanding of US sellers, Zillow Group Population Science conducted four nationally representative surveys of approximately 9,500 responses from more than 6,200 unique sellers between April and July 2024. Wherever possible, survey questions from previous years were asked in the same manner this year to allow for the measurement of year-to-year trends in key areas of interest.
For the purpose of this study, “sellers” are household decision makers 18 years of age or older who, within the past year, moved and sold a home that was their previous primary residence.
Sampling & Weighting
Estimates are nationally representative of recent sellers. US adult decision makers who recently sold a home were identified from online nonprobability samples. To achieve representativeness, ZG Population Science used statistical raking to ensure that the distribution of survey respondents matched the US seller population with respect to a number of key demographic characteristics. In order to align estimates with the most recent data on sellers, weighting utilized the 2022 American Community Survey (US Census Bureau, 2023) and other external benchmarks.
Quality Control
To reduce response bias, survey respondents did not know that Zillow Group was conducting the survey. Several additional quality control measures were also taken to ensure data accuracy:
- We identified and terminated any professional respondents, robots, and those taking the survey on multiple devices.
- We recorded completion times to ensure that surveys submitted by the fastest respondents, who may have rushed through the survey, did not provide poor quality data. If necessary, these respondents were removed from the sample.
- We added in-survey quality control checks to identify illogical or unrealistic responses.
Additional Data Sources
Unless otherwise specified, estimates in this report come from the Consumer Housing Trends Report (CHTR) 2024, and year-over-year comparisons also use data from CHTR 2018, CHTR 2019, CHTR 2020, CHTR 2021, CHTR 2022, and CHTR 2023. To provide a fuller picture of the state of home seller characteristics, preferences and behaviors, we also analyzed data from other sources:
- US Census Bureau, 2022 American Community Survey – The most recently available dataset from the US Census Bureau's survey of the US population. The ACS is the nation's largest survey and is based on a probability sample; as such, it is considered one of the leading sources of information on US population and housing.
- US Census Bureau, 2021 American Housing Survey – The most recently available dataset from the US Census Bureau's housing survey. The AHS includes housing details absent from the ACS, such as whether movers owned their previous home, their reasons for moving, and other detailed housing characteristics.
- U.S. Census Bureau, 2023 Current Population Survey Annual Social and Economic Supplement – The CPS ASEC offers the most recent social, demographic, and economic estimates on the US population.
- Zillow.com website metrics – To provide additional context for survey results, ZG Population Science also examined internal Zillow data on listing information.


